
Luminate (V1 archive)

Personal air quality, quietly understood

The air you meet every day.

Luminate turns the places you spend time and the journeys between them into a clear, personal picture of air pollution exposure.

Runs in the background No account required On-device timeline
Friday · your day

Timeline

Overall exposure
NO₂ 21 O₃ 48 PM₁₀ 18 PM₂.₅ 9
08:2407:10
Home1h 14m
08:5208:25
Morning walk27m
NO₂ 18O₃ 52PM₁₀ 16PM₂.₅ 8
17:3209:01
Work8h 31m
Your exposure story

Insights

7 days30 days90 days
PM₂.₅
11.8
PM₁₀
21.3
NO₂
23.4
O₃
48.9
−9%vs previous 30 days
214htracked this period
Journeys
WWalking14h 06m10.2
CCycling6h 32m13.6
TTube7h 48m38.4
BBus3h 14m15.9
Insights · Ask

Ask Luminate

When was my exposure highest this week?
Your highest NO₂ exposure was during Tuesday's evening Tube journey. 52.7 µg/m³ 21 minutes · Victoria line
What about walking?
Your cleanest walk was through Parkland Walk on Sunday. 12.4 µg/m³
Ask about your exposure…
Journeys + stopsOne continuous day
Average + doseFour key pollutants
7 · 30 · 90 daysPatterns over time
Quietly adaptiveDesigned for background use
01 / YOUR DAY

A diary you never have to write.

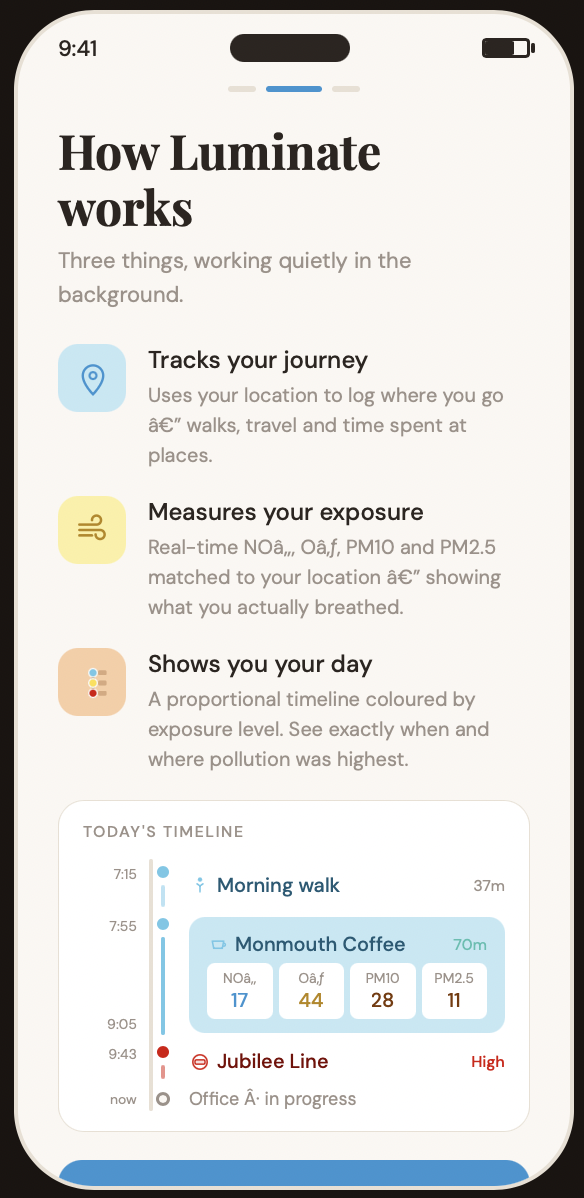
Luminate works quietly in the background, organising movement and time at places into a timeline that makes sense at a glance.

Journey detection

Walking, running, cycling, road and public transport are inferred from location, motion and movement patterns.

Places that become familiar

Confirm Home, Work and the places that matter. Luminate learns recurring locations while keeping you in control of every confirmation.

A map with memory

See the route for each journey, focus any part of your day, and revisit previous days from the calendar.

02 / EXPOSURE

Air quality matched to where you actually were.

A city-wide reading cannot describe a personal day. Luminate calculates modelled exposure for confirmed journeys and stops, including the time spent at home, work and everywhere in between.

Four pollutants · every confirmed segment

See where the day changed.

NO₂, O₃, PM₁₀ and PM₂.₅ are shown for each journey and stop in a shared colour language, making high and low moments easy to spot.
  • Route-aware estimates use timed coordinates and travel mode
  • Stationary periods are included, not treated as missing time
  • Overall values are time-weighted across the day
Luminate timeline showing journeys, stops and pollutant exposure
Two ways to understand exposure

Concentration and dose.

Switch between average concentration and modelled dose. The first describes the air; the second adds the duration and activity context that shaped your total exposure.

  • Compare a short high-exposure journey with a long lower-exposure stay
  • Separate journey and place contributions
  • Coverage is stated when parts of a period are still unconfirmed

Today

AverageDose
−18%lower PM₂.₅ than your recent weekday average
Morning walk · 8.2Work · 12.7Tube · 38.4Home · 9.1
03 / INSIGHTS

One day is useful. A pattern can change a habit.

Move from today's detail to a week, month, 90 days or a custom period. Compare travel modes, recurring places, high and low moments, and change against the previous period.

Daily · weekly · monthly · custom

Your exposure story, over time.

Understand which journeys contribute most, where you spend your time and whether your personal exposure is moving up or down.

  • Journey and place ledgers by pollutant
  • Highest and lowest episodes link back to the original day
  • Walking, cycling and other activity totals alongside exposure

30 days

PM₂.₅ · average
−9%vs previous period
214htracked time
WWalking38.2 mi · 14h 06m10.2
CCycling61.4 mi · 6h 32m13.6
TTube52.8 mi · 7h 48m38.4
Natural-language queries · computed locally

Ask your own data.

“When was my exposure highest?” “Was cycling cleaner than the Tube?” Ask Luminate translates everyday questions into structured queries over your timeline — not generic advice from the internet.

  • Questions use the dates, places, modes and pollutants in your history
  • Answers include their time period and data coverage
  • Designed to execute against on-device data
Which commute gave me the lowest NO₂ last month?
Your lowest average was on the days you walked through the park.14.2 µg/m³12 journeys · 8.6 hours
Compare with cyclingShow those daysAsk as dose
04 / UNDER THE HOOD

Sophisticated enough to disappear.

The seamless experience is supported by several systems working together: sensing, learning, exposure modelling, battery policy and a local-first data layer.

01 · ADAPT

Battery-aware sampling

Sampling responds to movement, battery state and device conditions rather than treating every minute alike.

02 · LEARN

Movement and place models

On-device signals classify journeys while confirmed recurring places build durable local context.

03 · CALCULATE

Route and stop exposure

Timed routes and stationary windows are matched to modelled pollutant fields for average and dose.

04 · EXPLAIN

From records to insight

Daily segments become comparable weeks and months without losing the journey that produced each result.

For the research community

A personal app. A potential population-scale research tool.

Luminate could support longitudinal studies of exposure, mobility, physical activity and response to information — without requiring every participant to buy, charge and wear a dedicated sensor.

Explore the research platform

Privacy by design

Your timeline stays with you.

Luminate does not require an account. Its detailed timeline is stored on the device, and exposure requests are sent only for ended segments that you explicitly confirm. You remain in control of location access and recording.

Read the privacy policy

Public beta now available on TestFlight

Take Luminate into your day.

Install the public beta to begin building your timeline and understanding the air pollution exposure across your journeys and places.

Install Luminate on TestFlight